
What is the difference between population and sample?

Introduction
People often fail to properly distinguish between population and sample. It is however essential in any statistical analysis, starting from descriptive statistics with different formulas for variance and standard deviation depending on whether we face a sample or a population.
Moreover, the branch of statistics called inferential statistics is often defined as the science of drawing conclusions about a population from observations made on a representative sample of that population. It is therefore crucial to properly distinguish between the two concepts. So, what exactly is the difference between population and sample?
Sample vs. population
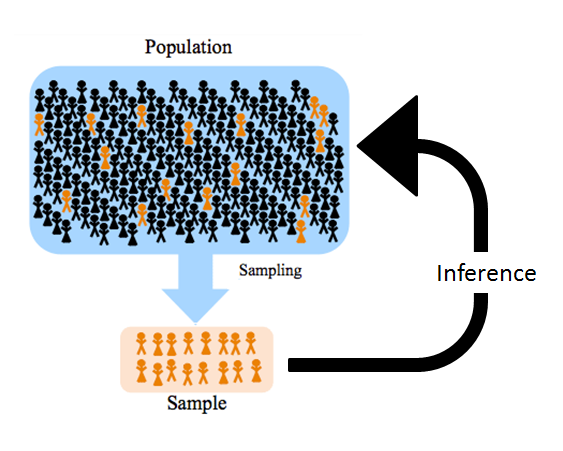
Population versus sample. Source: towardsdatascience.com
A population includes all members from a specified group, all possible outcomes or measurements that are of interest. The exact population will depend on the scope of the study. For example, say you would like to know whether there is an association between job performance and the amount of home working hours per week in the specific case of Belgian data scientists. In this case, the population might be Belgian data scientists. However, if the scope of the study is more narrow (e.g., the study focuses on french-speaking Belgian data scientists who live at least 30km away from their workplace), then the population will be more specific and include only workers who meet the criteria. The point is that the population should only include people to whom the results will apply.
A sample consists of some observations drawn from the population, so a part or a subset of the population. The sample is the group of elements who actually participated in the study.
Members and elements are defined in the broad sense of the term. It may be human. For instance, the population may be “all people living in Belgium” and the sample may be “some people living in Belgium”. It can be anything else too. Say you are testing the effect of a new fertilizer on crop yield. All the crop fields represent your population, whereas the 10 crop fields you tested correspond to your sample. Since a sample is a subset of a population, a sample is always smaller than the population.1 Note that, a population must not necessarily be large. It might be the case that you study such a narrow population (e.g., first-year male bachelor students from your university who passed the statistics exam in June and for whom their parents have been divorced for more than 5 years), that the size of the population is actually rather small.
Why a sample?
As mentioned at the beginning of this article, one of the main concern in statistics is being able to draw conclusions about a population from a representative sample. Why using a sample of the population and not directly the population? In general it is almost always impossible to carry out measurements for the entire study population because:
- the population is too large. Example: the population of pregnant women. If we want to take measurements on all pregnant women in the world, it will most likely either take too long or cost too much
- the population is virtual. In this case “virtual” population is understood as a “hypothetical” population: it is unlimited in size. Example: for an experimental study, we focus on men with prostate cancer treated with a new treatment. We do not know how many people will be treated, so the population varies, is infinite and uncountable at the present time, and therefore virtual
- the population is not easily reachable. Example: the population of homeless persons in Belgium
For these reasons, measurements are made on a subgroup of observations from the population, i.e., on a sample of our population. These measures are then used to draw conclusions about the population of interest. With an appropriate methodology and a sufficiently large sample size, the results obtained on a sample are often almost as accurate as those that would be obtained on the entire population.
Representative sample
Of course, the sample must be selected to be representative of the population under study. If participants are included in a study on a voluntary basis, there is a serious concern that the resulting sample may not be representative of the population. It may be the case that volunteers are different in terms of the parameter2 of interest, leading to a selection bias. Another selection bias can occur when, for instance, a researcher collects citizens’ wage, by the means of internet. It might be the case that people having access to internet have different wages than people who do not have access.
The gold standard to select a sample representative of the population under study is by selecting a random sample. A random sample is a sample selected at random from the population so that each member of the population has an equal chance of being selected. A random sample is usually an unbiased sample, that is, a sample whose randomness is not in doubt.
In some situations or domains (e.g., in medicine, psychology, etc.) it is complicated or even impossible to obtain a random sample of the population. In such cases, it will be important to consider how representative the resulting sample will be.
Paired samples
Last but not least, paired samples are samples in which groups (often pairs) of experimental units are linked together by the same experimental conditions. For example, one may measure the hours of sleep for 20 patients before taking a sleeping pill (forming sample A), and then repeat the measurements on the same individuals after they have taken a sleeping pill (forming sample B). Another example is the grades of 25 students at their statistics and economics exam. Among each student, grades for these two exams are undoubtedly associated (to some extent) to each other.
Paired samples are usually formed when a variable of interest is measured at different times on the same experimental unit. But, paired samples can also occur even when measurements are made at one specific point in time. For example, if we measure the strength in the right and left arm of 30 athletes. Strength in the right and left arm for the same individual are linked to each other, so sample A (for the right arm) and sample B (for the left arm) are paired samples.
The two measurements for each individual (hours of sleep before and after the sleeping pill, grades at two different exams, or the strength in the right and left arm) and the two samples are of course related. Statistical tools accounting for a relation between the samples exist and should be preferred in that case.
Conclusion
To summarize, the sample is the group of individuals who participated in the study and the population is the broader group to whom the results will apply. Measurements on the entire population is often too complex or impossible, so representative samples are used to draw conclusions about the population. Samples based on a random selection are often the most representative samples.
Thanks for reading.
I hope the article helped you to understand the difference between population and sample. For the interested reader, see the most common descriptive statistics that can be made on a sample or a population.
As always, if you have a question or a suggestion related to the topic covered in this article, please add it as a comment so other readers can benefit from the discussion.
There can be, however, many different samples from the same population. This is beyond the scope of this article, and at the moment we assume there is only one sample from a specified population.↩︎
The tools used to describe a population are called parameters, whereas the tools used to describe a sample are referred as statistics. See the most common descriptive statistics for a sample and a population.↩︎
Liked this post?
- Get updates every time a new article is published (no spam and unsubscribe anytime)
- Support the blog
- Share on:


